THEMATIC MAPS Details and Features
Defining a geographical place is an effort that, throughout human history, has been at the center of planning processes both scientifically and socially. The most important thing in this effort is mapping tools. However, maps are not only tools that convey the physical appearance of a region, but also strong communication that shows the spatial distribution of social, cultural, and environmental phenomena. As a result of this context, thematic maps stand out as special types of maps that make it possible to analyze a specific subject in terms of location. It is a map that focuses on a specific subject and theme. These maps visualize the intensity, distribution, and relationships of certain data in a geographical area.
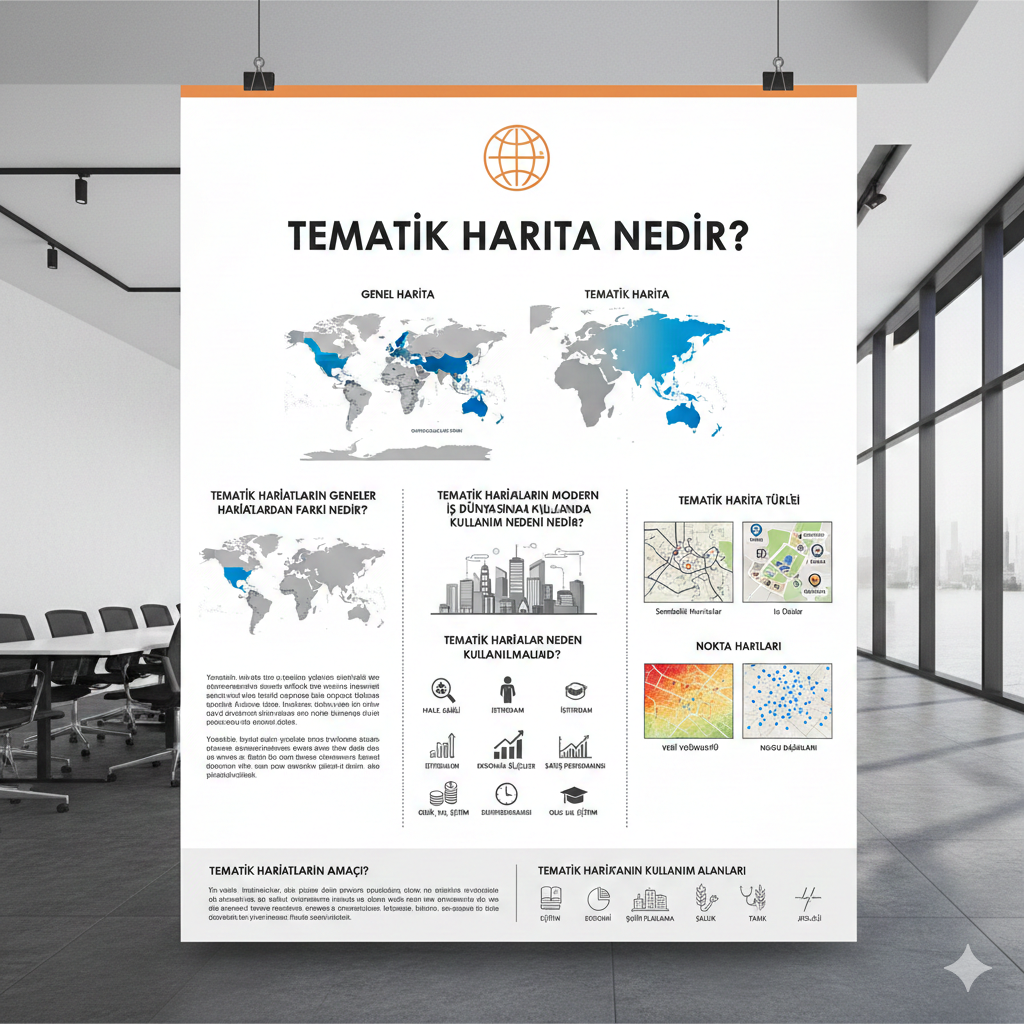
A thematic map is a type of map that shows a predetermined theme, its specific feature, or variable formation on the geographical space. It is a type of map that focuses on a theme and subject.
Thematic Maps are single-topic maps that focus on themes and phenomena such as rainfall amount, population density, and rainfall amount. By bringing together relevant information such as income distribution and regions more dependent on delivery locations, they help understand the relationship between these themes and geographical locations and represent the data spatially. The purpose of this map is not to provide general geographical information but to present a selected theme clearly on the space. In this case, thematic maps are one of the most important tools that strengthen both the educational and analytical aspects of geography.
WHAT IS THE DIFFERENCE BETWEEN THEMATIC MAPS AND GENERAL MAPS?
A normal map, meaning a political or topographic map, provides general information such as mountains, rivers, roads, and cities. But in thematic maps, such information is found only in the background for guidance (leading). The emphasis is actually on the theme being processed. For example, if a world map shows literacy rates, the literacy data is at the center of the map, while all other information is secondary. Since it focuses on a specific theme and phenomenon, it is a single-topic map. In such map types, there are distinct differences in purpose, content, and usage. Thematic Maps differ from other map types with their structure that emphasizes a selected topic, offers detail, and is target-oriented. The purpose of a thematic map is to focus on a single topic. A general map directly provides general information. In thematic maps, all attention is directed to the selected theme. The colors, lines, symbols, and explanations used on the map are chosen entirely to explain this theme. General maps contain a lot of information. They show in detail what exists in any region (roads, tunnels, cities, rivers, elevation, boundaries, etc.). Most information is given not based on a theme, but to provide the user with a broad perspective.
In thematic maps, in an earthquake risk map, city names may be small and faint. But fault lines or risk levels are very obvious. The symbols and colors are designed to explain the theme.
WHY ARE THEMATIC MAPS USED IN THE MODERN BUSINESS WORLD?
Today’s business world is shaped by rapidly changing economic conditions, increasing competition, and data-driven decision-making processes. Companies need tools that allow them not only to see promotional data but also the spatial distribution of these data. Therefore, thematic maps have become one of the most powerful analytical tools of modern businesses. Thematic maps make it easier to understand complex data by displaying it over a predetermined subject area. They also help companies make more accurate and strategic decisions.
WHY SHOULD THEMATIC MAPS BE USED?
A thematic map filters unnecessary details about physical locations and terrain and focuses only on showing the distribution and intensities of information selected by the user. Thus, patterns in the data become instantly visible.
Common thematic matches:
-
Disease areas and outbreak focus points in public health.
-
Employment rates.
-
Economic indicators.
-
Both sales performance and market share or retail sales points.
-
Characteristics such as income, age, and education.
TYPES OF THEMATIC MAPS
Symbolic Maps, heat maps, dot maps
A symbolic map represents a geographical area or a specific theme abstractly with symbolic representations. These are maps where real geographical shapes are simplified or completely altered. The purpose of these maps is that the colors, symbols, and signs used carry meaning and provide quick information to the reader. In symbolic maps, real measurement and scale are not mandatory. The symbol is at the forefront. It keeps the information simple. It is both instructive and guiding.
Heat maps are a visual representation that expresses the density or value changes in a dataset with colors. In these maps, the word “heat” does not mean actual temperature but represents the intensity of the data. In short, it shows not the temperature of the area but the amount, movement, and importance level of the data in the environment through color coding.
Dot maps are maps based on distribution that visualize and operate the geographical distribution of a large number of related phenomena. Dots can represent actual locations of an individual phenomenon or be randomly placed in regions to represent a group of individuals. They show the distribution of an event, object, data, or geographical elements on Earth.
WHAT IS THE PURPOSE OF THEMATIC MAPS?
The main purpose of a thematic map is to show where a subject is concentrated, where it decreases, what kinds of differences it shows in various regions, and how spatial relationships occur. Thematic maps are both a guiding and instructional resource for students. They are a database-based map that guides and assists decision-making.
USAGE AREAS OF THEMATIC MAPS
In education as a teaching space, in economics for market and production areas, and in urban planning for settlement density, transportation, and infrastructure.
In health, for disease and risk areas.
In agriculture, for product distribution and productivity.
In geology, most importantly, for earthquake belts and the significance of fault lines.